Course Information
Advanced Control Charts Training
Learners will be able to:
- Choose the appropriate control chart for the process.
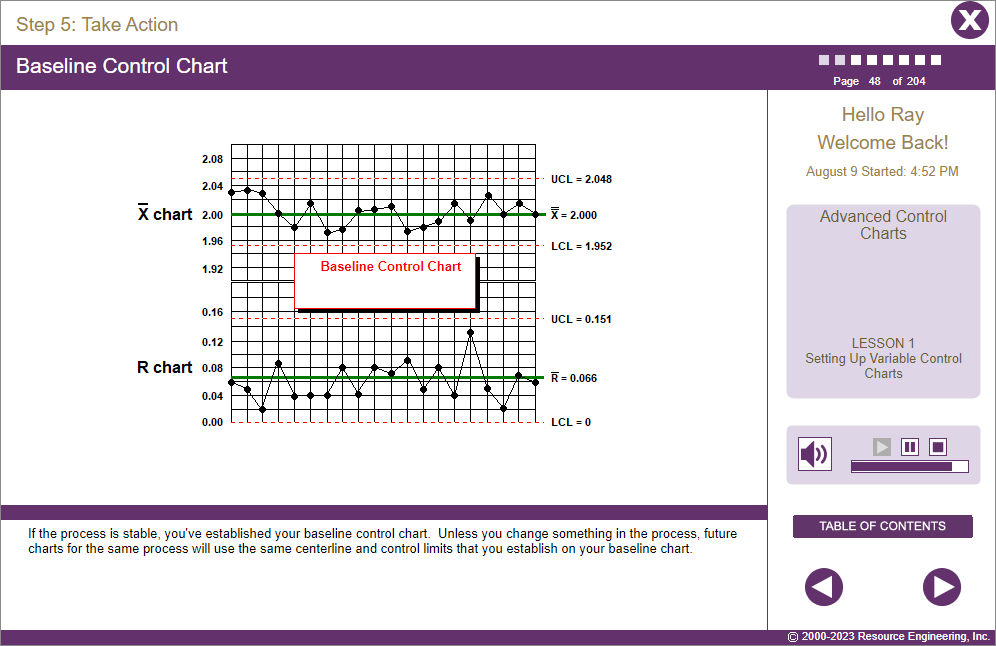
- Create a control chart for future process monitoring.
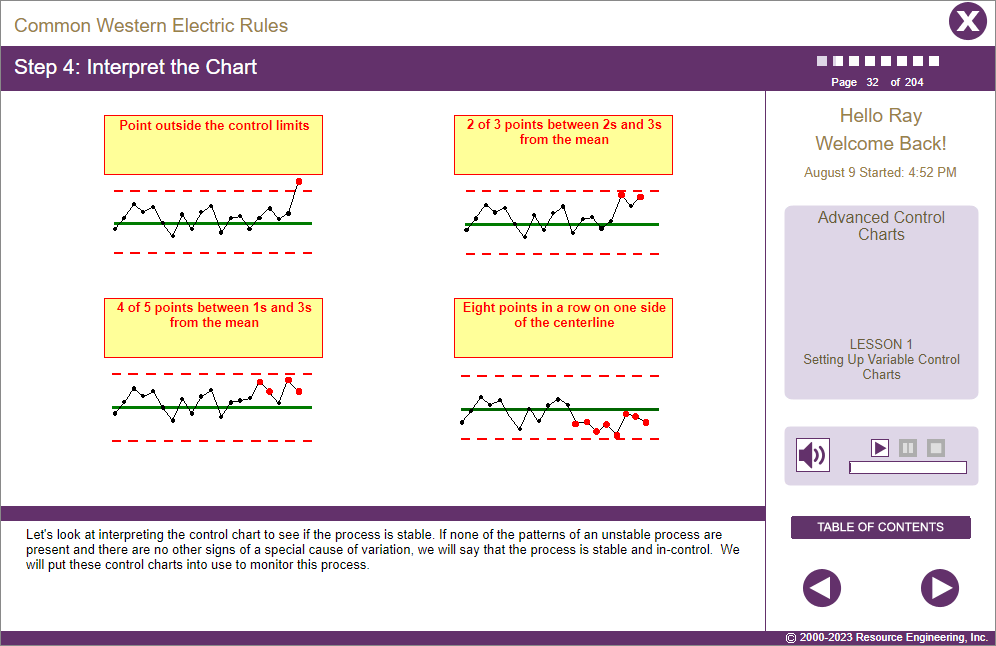
- Analyze and interpret process behavior.
About This Course
Control charts are tools that are used to monitor and control variation in processes. Control charts enable operators to determine if the variation in a process is due to expected common causes or if something unexpected has happened to change the expected output. With this information, an operator can then decide whether or not to adjust the process.
Selecting and setting up the right type of SPC control chart for a given process is crucial to getting the most benefit from statistical process control.
With Advanced Advanced Control Charts online training, your in-house experts will be able to apply advanced statistical techniques and concepts throughout your operations. Training topics include selecting and setting up SPC Control Charts, determining the best control chart format to use for a given process, identifying different patterns of instability, and knowing what they tell you about a process.
- A good understanding of statistical measures of variation including standard deviation.
- Ability to use a control chart.
- Successful completion of Basic SPC or the equivalent.
- English (EN-US)
- Chinese (simplified) (ZH)
- Czech (CS)
- French (FR)
- German (DE)
- Italian (IT)
- Japanese (no audio) (JA)
- Korean (no audio) (KO)
- Polish (PL)
- Portuguese (Brazilian) (PT-BR)
- Romanian RO)
- Russian (RU)
- Spanish (ES)
- Vietnamese (no audio) (VI)
Course Objectives
- Set up an x-bar and R control chart.
- Interpret the control chart to determine if a process is stable.
- Set up an attribute (p, np, c, or u) control chart.
- Understand how to use the most common tests of instability.
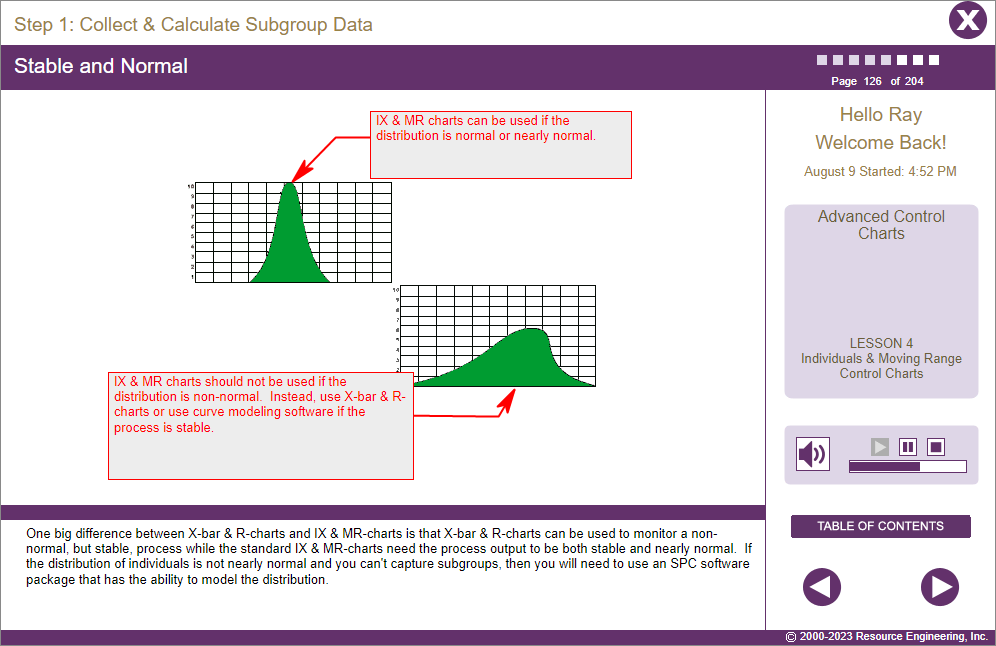
- Set up an Individuals and Moving Range control chart.
- Explore options to the conventional x-bar and R control chart.
- Select the most appropriate alternative format for a variable control chart.
Course Outline
Lesson 1 | Setting Up Variable Control Charts
- Calculating control limits and establishing a baseline chart.
Lesson 2 | Setting Up Attribute Control Charts
- Setting up p, np, c, and u charts.
Lesson 3 | More Patterns of Instability
- Explanations of Western Electric, AIAG, Nelson, & Boeing rules.
Lesson 4 | Setting Up Individuals & Moving Range Control Charts
- Calculating control limits and establishing a baseline chart for IX & MR Charts.
Lesson 5 | Special Control Charts & Applications
- Variations on the standard variable data control charts.
Challenge
- An assessment of the learner’s progress in this course.

4.6 out of 5 stars
Comments from Learners About This Course
- Great course!
- Excellent course on Control Charts.
- Good pace.
- I love it.
You may also be interested in…
- Advanced Process Capability – Step-by-step training in how to conduct a process capability study as well as how to handle process capability study complications.
- DOE: Screening Experiments – Comprehensive training in one of the most powerful families of Designs of Experiments – Screening Experiments. Includes training in both Plackett-Burman designs and Taguchi techniques.
- Mistake-Proofing Training – Comprehensive online training in poka yoke/mistake-proofing techniques for manufacturing operations.