Course Information
Control Chart Basics Training
Learners will be able to:
- Describe the features and functions of a control chart.
- Use a control chart to monitor a process.
- Interpret control chart results.
About This Course
Control charts are tools that are used to monitor and control variation in processes. Control charts enable operators to determine if the variation in a process is due to expected common causes or if something unexpected has happened to changed the expected output. With this information, an operator can then decide whether or not to adjust the process.
This course provides training in what control charts are, what they look like and how to interpret them and take action based on what they are telling you about your process. Types of control charts including both variable and attribute control charts is also covered. This course is a targeted training course and provides focused training on how to use control charts at an operator level. For comprehensive training on how to use control charts and their underlying principles, we recommend our Basic SPC training.
- Basic math skills.
- An understanding of the concepts of variation and process stability.
- English (EN-US)
- Chinese (simplified) (ZH)
- Czech (CS)
- French (FR)
- German (DE)
- Italian (IT)
- Japanese (no audio) (JA)
- Korean (no audio) (KO)
- Polish (PL)
- Portuguese (Brazilian) (PT-BR)
- Romanian RO)
- Russian (RU)
- Spanish (ES)
- Vietnamese (no audio) (VI)
Course Objectives
- Understand the purpose of a control chart.
- Identify key parts of a control chart.
- Know how to collect and plot data on a control chart.
- Be able to interpret and take action using a control chart.
Course Outline
Lesson 1 | What are Control Charts
- What control charts are and why they are used.
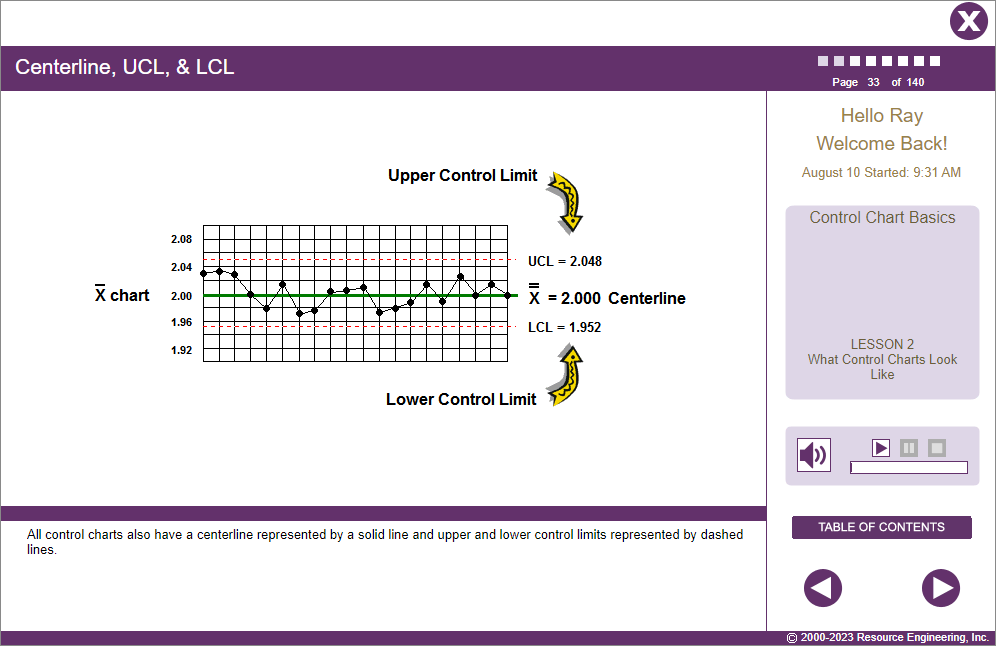
Lesson 2 | What a Control Chart Looks Like
- Common elements of all control charts.
Lesson 3 | Interpreting Control Charts & Taking Action
- Out-of-control patterns and what to do when they occur.
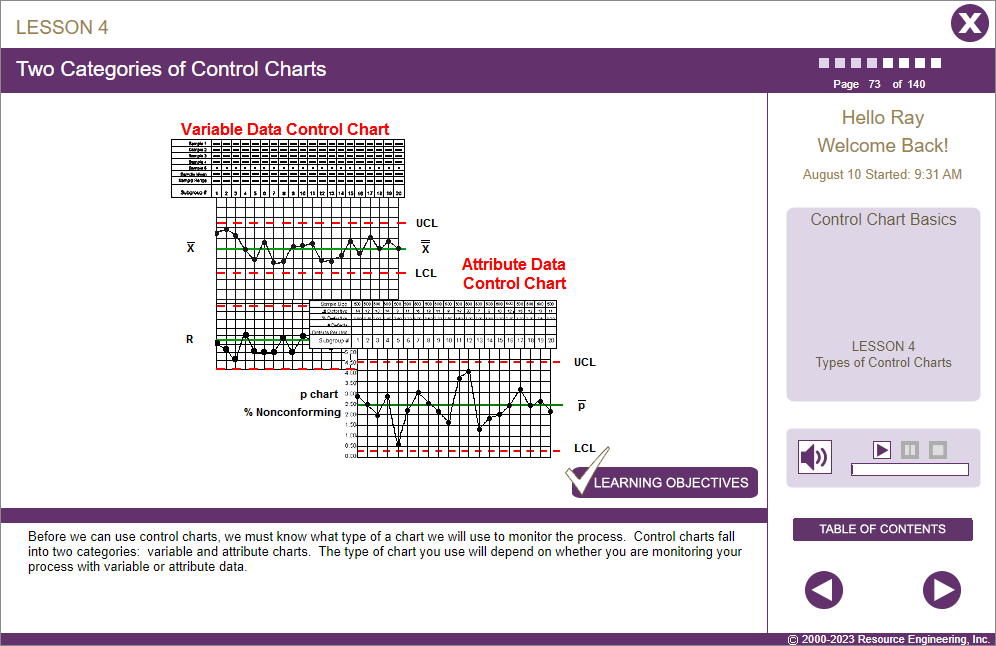
Lesson 4 | Types of Control Charts
- Variable and attribute control charts: Which do you use when?
Lesson 5 | Using Variable Control Charts
- Calculating and plotting data on variable control charts and interpreting the chart.
Lesson 6 | Using Attribute Control Charts
- Calculating and plotting data on attribute control charts and interpreting the chart.
Challenge
- An assessment of the learner’s progress in this course.

4.6 out of 5 stars
Comments from Learners About This Course
- Very informative; I learned a lot.
- Great Course and very helpful.
- Very good basics.
You may also be interested in…
- Basic SPC Training – Comprehensive training in understanding and controlling variation using statistical process control and control charts.
- Advanced SPC Training – Comprehensive training in how to implement statistical process control including setting up control charts and conducting process capability studies.
- Mistake-Proofing Training – Comprehensive online training in poka yoke/mistake-proofing techniques for manufacturing operations.