Course Information
Quality Improvement Fundamentals Training
Learners will be able to:
- Turn data into a picture that provides clues about problems in a process or product.
- Use 8 powerful data display tools.
- Combine data display tools to uncover more clues about the problem.
About This Course
Why are Quality Improvement Fundamentals so Powerful?
All processes generate data and that data can help us better understand our processes so that we can make informed decisions on how to improve or “fix” them. If we use data display tools, those tools help present the data in the form of a “picture” that provides valuable clues about what is happening with the process and its outcomes. Quality Improvement Fundamentals focuses on gathering data and using that data with eight powerful data display tools. The eight tools all use display techniques that literally turn the data into pictures.
Quality Improvement Fundamentals Training
This targeted training makes a strong and compelling case for using data to analyze problems and make decisions. Learners are introduced to 8 Quality Improvement Tools that will enable them to easily collect data, uncover clues and fix problems either on their own or in teams. This course doesn’t support any particular methodology, but rather focuses on the core tools and techniques that are at the heart of any problem-solving process. For training on specific problem-solving methodologies please check out 8D Problem-Solving online training or DMAIC Basics online training.
- Learners should have an interest in making improvements in their jobs.
- English (EN-US)
- Chinese (simplified) (ZH)
- Czech (CS)
- French (FR)
- German (DE)
- Italian (IT)
- Japanese (no audio) (JA)
- Korean (no audio) (KO)
- Polish (PL)
- Portuguese (Brazilian) (PT-BR)
- Romanian RO)
- Russian (RU)
- Spanish (ES)
- Vietnamese (no audio) (VI)
Course Objectives
Lesson 1 | The Importance of Data
- Understand and respect the need for data to make decisions.
- Realize how the use of a Problem Statement helps to focus an improvement effort.
- Recognize that all processes have inputs, value-added and outputs as well as variation in each aspect.
Lesson 2 | Data Display Tools
- Use data display tools to transform information into a graphical display of patterns.
- Learn to use Cause and Effect Diagrams, Tally Sheets, Histograms, Trend Charts, Scatter Diagrams, Concentration Diagrams, Pareto Charts and Process Maps.
- Know how to combine tools to generate a different perspective of the process under study.
Lesson 3 | Follow the Evidence
- Be familiar with how patterns (from data) can be used to develop a working theory.
- Understand that identifying the root cause is a significant event.
- Be familiar with verifying and validating the solution to a problem.
Course Outline
Lesson 1 | The Importance of Data
- Data can help us better understand the processes we work in and compare past performance to current performance.
- It is important to document the improvement target before tackling a problem.
- How to turn data into a picture.
Lesson 2 | Data Display Tools
- Cause and Effect Diagrams
- Tally Sheets
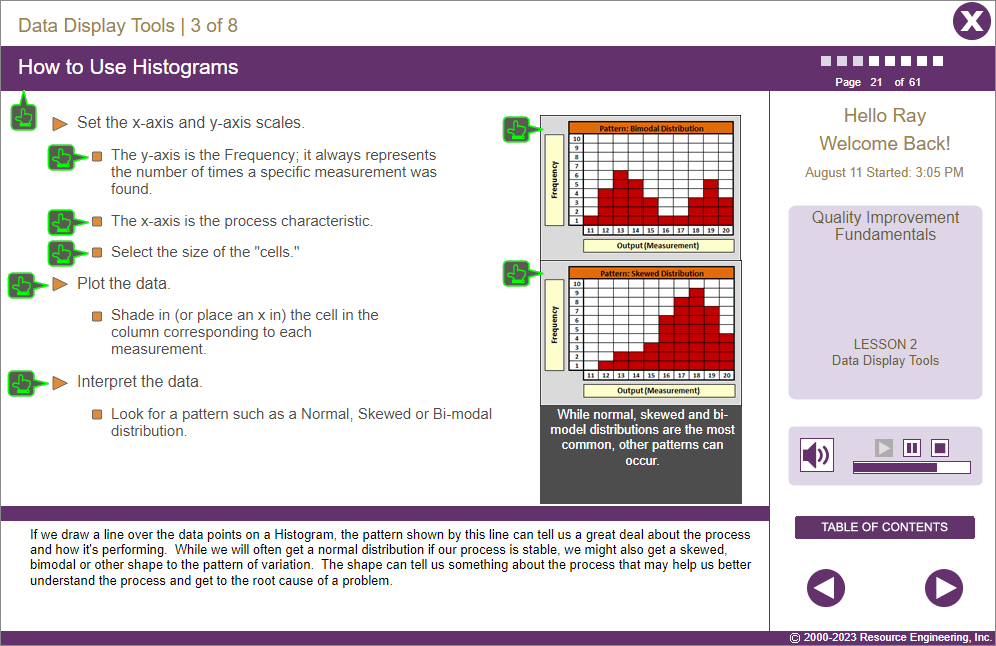
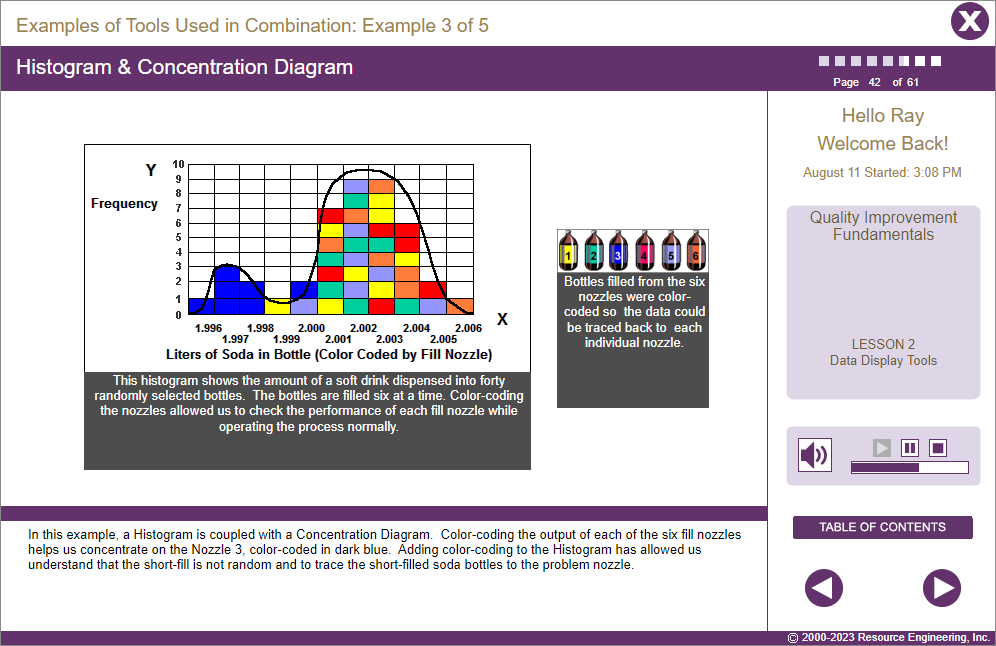
- Histograms
- Trend Charts
- Scatter Diagrams
- Concentration Diagrams
- Pareto Charts
- Process Maps
Lesson 3 | Follow the Evidence
- Looking for patterns in the data.
- What do patterns tell us.
- Getting to the root cause of a problem.
Challenge
- An assessment of the learner’s progress in this course.

4.5 out of 5 stars
Comments from Learners About This Course
- Course content creates a realistic picture of the steps, tools and process to develop concrete objective evidence of the problem or issue leading to effective/efficient root cause(s) in order for final steps of mitigation.
- Very good; got me thinking.
- A good source of knowledge. I never knew I could put two problem-solving techniques together such as a fishbone and a tally sheet.
- Very informative course, worth while for anyone in Quality.
- Course provided a good general overview into the tools utilized to provide a graphical representation of data and why they are utilized. In addition, the examples were simple to understand and grasp.
You may also be interested in…
- Introduction to Mistake-Proofing – Online training is designed to introduce learners to the prevention-focused mindset that is the cornerstone of mistake-proofing and to familiarize learners with the concepts, tools, techniques and terminology used to formulate (and evaluate) mistake-proofing solutions.
- 8D Problem-Solving – Step-by-step training in how to work on a problem-solving team follow the 8D methodology including tools and techniques that are used in each step.
- DMAIC Basics – Web-based training on how to solve problems using the DMAIC (Define-Measure-Analyze-Improve-Control) process.