Resource Centers
Plackett-Burman Matrices
Derived from full-factorial matrices
- Using the assumption that all interactions are insignificant relative to main factor effects, English statisticians Drs. Plackett and Burman derived screening experiments matrices from full-factorial experiments matrices.
- They took a basic three-factor, two level matrix and modified it to reduce the confounding.
- Main factor effects in Plackett-Burman designs replace all interactions of the full factorial matrix.
- However, this does not mean that information about interactions cannot be determined from Plackett-Burman designs.
Screening experiments identify the “Power Factors” in a process.
- Power factors are the process variables that most significantly affect the process outputs, or responses.
- In this unit, we cover the family of Plackett-Burman screening experiments that look at “f factors” in “f+1 treatment combinations.”
- Regardless of whether the experimental objective is to maximize the response, minimize the response, or hit a target, the power factors are the critical process or product variables used to adjust and control the process or product output.
Plackett and Burman developed many designs.
- Selection of the most appropriate design matrix will be determined in large part by the number of factors selected for the experimentation.
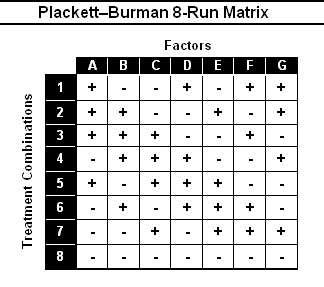
- With an 8-Run Plackett-Burman design, we can look at up to 7 factors; with a 12-Run design, up to 11 factors; with a 16-Run design up to 15 factors, and with a 20-Run design, up to 19 factors.
- The matrix that you select will depend on the number of factors to be experimented upon plus the method chosen to determine the experimental error.

There are several ways to determine the experimental error.
- Among the options are:
- Select the center point of the experimental levels and make several experimental runs at that point;
- Replicate the entire experimental matrix;
- Make multiple independent measurements within a treatment combination;
- Use dummy factors; and
- Use pooling. (Of these approaches, pooling is the least favored.)
Analyzing experimental results.
- Once the experiment is run and the samples measured, the data from the experiment are used to calculate the effects and to determine the statistical significance of those effects.
- Simply use the same matrix to analyze the experiment as was used to set up and run it.
- First, calculate the effects.
- To calculate the effects, enter the average responses into the matrix for each treatment combination.
- Then, working with the columns, determine the effect, which is the difference between the average response at the high level and the average response at the low level. Using the signs in the column, add up the responses and then divide by the number of pluses.
- Take care to note the sign of the effect.
- The effect for a factor is always described as the change in the response in going from the low level of that factor to the high level.
- A negative sign means that going from low level to high level for a factor decreases the response.
- A positive sign means that going from the low level to the high level increases the response.
- Remember the experimental objective.
- Determining which levels to set the factors at depends on the experimental objective.
- If the goal is to maximize a response, then all factors with a positive effect would be set to operate at their high levels and all factors with a negative effect would be set to operate at their low levels.
- If the objective was to minimize the response, then all factors with a positive effect would be set at low levels and all with a negative effect would be set at high levels.
- If the goal was to be closest to target, then the effects will be used to determine how to change factor levels to dial in the process.
- Is the effect statistically significant?
- There is no way to know if the effects are due to changes made in the factor levels or due to common cause variation in the process unless their statistical significance is tested.
- If an effect does test to be statistically significant, the associated factor is a power factor.


