Resource Centers
Measurement System Linearity – Type A Uncertainty
Linearity looks at the accuracy of the measurements over the full range of the device.
- In order to measure the linearity of a device, we must take repeated measurements of parts or samples that cover its entire range.
- So that we don’t introduce reproducibility error into the picture, the same operator must make all the measurements.
To check linearity, measure at least 5 samples that cover the full the range of the instrument.
- Reference measurements for each of the samples (made by your quality group or by an outside laboratory) will be needed to determine linearity.
- The reference measurements will be compared to the results from the instrument whose linearity is being studied.
- Measure each of the samples randomly at least 10 times.
- For each of the parts, calculate the average and the range of the measurements made. The sample averages and ranges will be used with the reference values to determine linearity either graphically or by calculations.
Graphical Method:
- Plot the average measured values (on the y-axis) for each sample against the reference value (on the x-axis). If the resulting line is approximates a straight line with a 45-degree slope, the measurement device is linear.
- If the measured values do not form a straight line, or the line diverges from the optimal 45-degree slope, you may have a problem with linearity.
Calculating Linearity:
- A technique does exist that provides a precise mathematical evaluation of the linearity.
- The evaluation is based on the equation of a line that defines the relationship between the bias and the reference values of the parts or samples.
- The bias is the value of the sample measurement minus the reference measurement.
- To calculate the line of best fit, use the equation:
y = ax + b
where:
y = bias value
a = slope of the line
x = reference value
b = the y-intercept
- To calculate the slope, a:

where:
n = total number of measurements made
- To calculate the y-intercept, b:

- With values for a and b, we can complete the regression equation (y = ax + b); it gives us the line of best fit.
- Using the results of the regression equation, we can determine the “goodness of fit” by calculating the Coefficient of Determination, R2.

- R2 lets us know what amount of the variation in the bias values the regression line explains.
- If R2 is 0.6 (60%) or more, the regression line is an adequate representation of the line of best fit.
Calculating the linearity and bias.
- Linearity = a, slope of the line of best fit
- Bias = b, y-intercept of the line of best fit
Test the linearity
- State the hypothesis
H0: a = 0
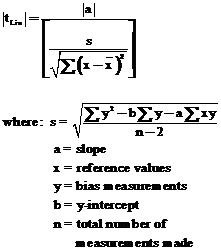
- Calculate t for linearity

- Determine the critical value of t.
- Use a t-table or spreadsheet program to determine tcritical.
- Typically an α risk of 0.05 is used.
- Accept or reject the hypothesis.
- If tLin > tcritical, reject the hypothesis that the linearity is zero.
- If tLin < tcritical, accept the hypothesis that the linearity is zero. The linearity of this measurement device is acceptable.
Test the bias
- State the hypothesis
H0: b = 0
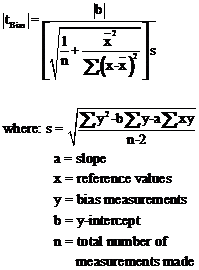
- Calculate t for bias

- Determine the critical value of t.
- Use a t-table or spreadsheet program to determine tcritical.
- Typically an risk of 0.05 is used.
- Accept or reject the hypothesis.
- If tBias > tcritical, reject the hypothesis that the bias is zero.
- If tBias < tcritical, accept the hypothesis that the bias is zero. The bias of this measurement device is acceptable.
If linearity or bias fails the t-test, the device is unacceptable. The options include:
- Recalibrate the device and recheck the linearity and bias.
- Replace the device with one that is linear.
- Use the device over only the linear portion of the range.


