Resource Centers
R&R Analysis Using ANOVA
Analysis of Variance, or ANOVA for short, is an experimental design technique that looks at a number of variables at the same time.
- It is used to help determine which of the variables under study have a statistically significant impact on the process output.
- With measurement systems, we can explore how the test equipment and appraiser variables affect the measurement system output.
ANOVAs allow us to study four measurement system components:
- Variation between parts or samples.
- Reproducibility between operators or appraisers.
- Repeatability of the measurement equipment.
- Interaction between the samples and the appraisers.
The use of ANOVA does have some advantages over standard GR&R studies:
- ANOVAs provide information on interactions between samples and appraisers.
- With an ANOVA, we can vary the number of samples, appraisers, trials, and even the number of measurement devices to get a more accurate picture of the variation in the measurement system.
- ANOVAs allow us to get an accurate estimate of variances.
- ANOVA techniques are the preferred method for analyzing measurements for destructive testing.
Disadvantage of ANOVA:
- Calculations using ANOVA are more complex than those with other techniques. It is best to use a computer with DOE software for the calculations.
ANOVA Data Format
- A standard 2-factor ANOVA format is used for analyzing measurement systems.
- Factor A is used to designate the parts or samples. Factor B represents the appraisers.
- The number of levels for each factor is a function of the number of samples and the number of appraisers.
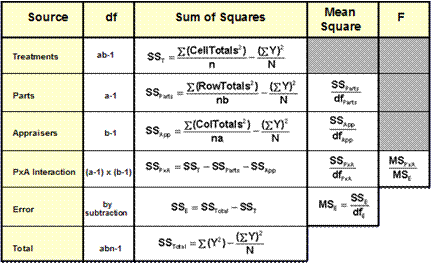
ANOVA Table

Where:
a = number of levels of a
b = number of levels of b
n = sample size per cell
N = total number of measurements made
Mean Square Values
- Mean square values are calculations of variance. The variance is the standard deviation squared.
- Mean square values are calculated for the Parts (MSParts), Appraisers (MSAppraisers), the Parts x Appraisers Interaction (MSPxA), the Error (MSError), and a “Pooled” term MSPool, if appropriate.
PxA Interaction
- We will evaluate the significance of the Parts x Appraisers Interaction using the F-test.
- If this interaction is significant, we will need to investigate the reasons for it.
![]()
- If it is not significant, we will assume it is really part of the experimental error and pool the PxA Interaction value in with the Error Value.
Calculating Repeatability
- If the PxA Interaction is not significant, then the Repeatability statistic, sE, is determined by pooling the MSError and MSPxA.

- If the interaction is significant, then the Repeatability statistic, sE, is determined from the MSError
![]()
Calculating Reproducibility
- The Reproducibility, sA, is determined by the MSAppraisers with a correction term to account for confounding from the instrument variation.
- If the PxA Interaction is not significant:

R&R Calculations
- If the PxA Interaction is not significant, the R&R is simply:
![]()
- If the PxA Interaction is statistically significant, the R&R calculation is more involved:
![]()
where:
![]()
r=number of trials
R&R as a % of the Total Tolerance (TT)
![]()
- We prefer the measurement system to take up less than 10% of the Total Tolerance. If it takes up 30% or more of the TT, the measurement system needs work.
R&R as a % of the Total Variation (TV):
![]()
- If the %GR&R is greater than 30% of the total variation, then the measurement system should be improved.
- To calculate the percentage of the total variation taken up by the measurement system, we need to know both the Part Variation (PV) and the Total Variation, TV.
- If the PxA Interaction is significant:
![]()
- If the PxA Interaction is not significant:
![]()
- With PV known, TV can be calculated:
![]()
Contribution of MSA to Total Variation:
- We can also calculate the contribution that the measurement system actually makes to the total variation. The formula for the % Contribution is:
![]()


