Resource Centers
More Process Capability Indices
There are several different variations on Process Capability Indices. They are Pp, Ppk, Cpm, and Ppm.
Pp and Ppk are called Process Performance Indicators.
- As their description implies, Pp and Ppk look at what the performance could be. Some people refer to them as short-term capability indices because they do not look at process variation over time.
- Another use of the Process Performance Indicators today is to get a look at how the total variation from the process compares to the specification. Even special causes are included in the determination of total variation.
Editorial Note: We believe that the inclusion of special causes creates some problems for these indicators. Per AIAG manuals, Pp and Ppk are based on a “statistically stable” process with process data that form “an approximately normal distribution.” In our view, it is hard to see how a process can be statistically stable while having special causes of variation; we suggest Ppk and Pp are best used as preliminary process performance indicators.
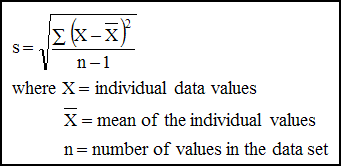
- The formulas for Pp and Ppk are quite similar to those for Cp and Cpk. The big difference between them is how we calculate the sample standard deviation, s.
For Pp and Ppk, the sample standard deviation, s, is calculated directly from the data using:

For Cp and Cpk, s is calculated by using R-bar/d2.
Typically there will be less sources of variation represented in a preliminary process performance study than in a process capability study so the preliminary Ppk value is usually greater than the Cpk value for a process.
Cpm is the process capability measured against performance to a target.
- The Cpm capability index compares the width of the specification to the spread of the process output plus an error term for how far the center of the distribution is from the target.
- The process is penalized for not running on-target. And since the difference-from-target term is squared in the calculation, as the distance from the target increases, the penalty increases dramatically.
- For a centered process that is on-target (that is, the center of the specification is the target), Cp, Cpk, and Cpm will be equal. When close to center, we often find that the Cpk and Cpm values are similar. But if the mean is more than one standard deviation away from the target, then the three indices will give us very different views of the process capability.
Ppm is a process performance index based on Cpm.
- Like Pp and Ppk, Ppm uses the standard deviation equation, and not subgroups, to calculate s.


