Resource Centers
What Control Charts Look Like
All control charts have four major sections:
- Information section
- Data section
- Graph section
- Comments section
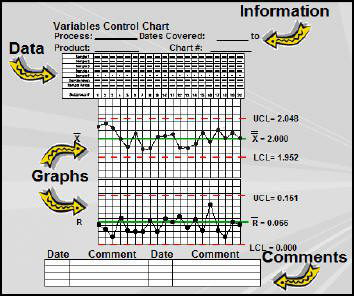
An area of the control chart that is often overlooked is the Comments section.
- If your process has gone out-of-control, the notes in this section will give you clues as to why the process went out-of-control.
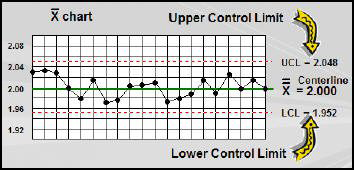
All control chart graphs have a centerline and upper and lower control limits.
- The centerline represents the process mean, or grand average, for the process.
- The upper and lower control limits show the extents of the common cause variation in the process. They approximate plus and minus three standard deviations from the process mean.